
Is Your Cafe Leaking Cash? The Operational Red Flags You Can't Ignore
The margin for error in the 2026 coffee landscape has effectively vanished. For many independent operators, the difference between a thriving business and a profit crisis comes down to identifying subtle operational "leaks" before they become floods. The ability to leverage data as a diagnostic tool is no longer a luxury but a fundamental requirement for operational resilience. Many talented baristas and passionate owners struggle not because their beans are poor, but because their operational vitals are ignored. Understanding these red flags is the first step toward building a resilient brand that customers trust.
The personalization gap and Perceptual Misalignment
One of the most misunderstood metrics in our industry is the "personalization gap." Many early operational manuals suggested that only 16% of customers find coffee brands are differentiated, recent 2024 and 2025 consumer behavior reports clarify a much deeper issue: only 16% of consumers actually feel they encounter meaningful personalization when interacting with brands.[1] This is a massive red flag. If your regulars feel like just another transaction, you are failing to build the relationship-based loyalty that sustains a business during economic downturns. True consistency must extend beyond the flavor profile to include the entire personalized experience.
Financial Fragility and the 35% COGS Red Flag
Financial fragility often reveals itself through the Cost of Goods Sold (COGS). Industry experts and financial analysts are in agreement that once your COGS climbs above 35% of sales, your business is entering a danger zone.[3] In early 2025, Arabica prices surged to a historic high of $4.41 per pound due to climate disruptions, making this 35% threshold harder than ever to maintain. If you aren't tracking every drop of milk and every gram of waste, these rising ingredient costs will silently devour your take-home profit, which typically lands between 10% and 25% for a healthy independent cafe. [2][3]
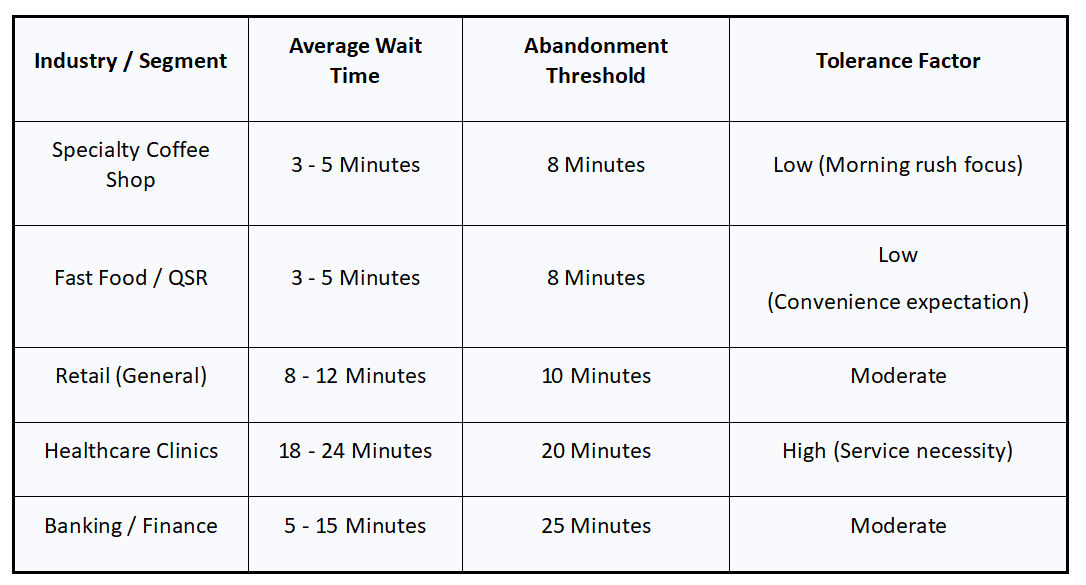
Wait Tolerance and Abandonment Statistics by Industry
Another silent killer is the 120-second bottleneck. When service times rise, the business encounters "queue abandonment." The psychology of waiting in 2026 is governed by a rapidly shrinking tolerance threshold. The average customer will wait approximately 8 minutes in a coffee shop queue before leaving, but for the crucial Gen Z and Millennial demographics, this threshold is closer to 3 to 5 minutes.[4] This "silent business killer" results in a direct loss of revenue that often does not appear on traditional POS reports because the transaction never occurred. During peak hours, an estimated 20% to 30% of potential orders are lost due to customers abandoning the line or bailing upon seeing the wait.
Reference:[4]~[7]
The economic loss associated with abandonment is profound. While a single lost transaction may only represent $6 to $12 in immediate revenue, the aggregate impact is staggering. For a high-traffic urban location, queue abandonment can result in $12,000 to $35,000 in lost revenue per month. Beyond the immediate sale, each abandonment risks eroding Customer Lifetime Value (CLV), as disappointed patrons migrate to more efficient competitors.
Modern solutions to these bottlenecks include the implementation of digital queue management systems and self-service kiosks. These technologies have been shown to reduce actual wait times by up to 30% and perceived wait times by 35% through the "transparency effect"—where customers are more patient because they understand their place in line and the estimated time remaining.[4] For Unimate Coffee Inc., the focus is on achieving a service speed that aligns with these 2026 consumer expectations, often serving in under 60 seconds to ensure that no customer is lost to the clock.
Menu Engineering and the decision Fatigue Trap
A common failure point in modern coffee operations is the expansion of the menu beyond the point of operational efficiency. While offering global flavors like Matcha is essential for attracting Gen Z consumers—Matcha menu items grew 30% YoY in 2026—an over-complicated menu increases inventory costs and creates "decision fatigue" for the customer.5 Research from the Menu Engineering Lab found that simplifying a menu can increase sales by 10% to 15% while reducing inventory costs by 20% to 30%.[8]
The key to successful menu engineering in 2026 is identifying high-margin versus low-margin items. A standard latte has a gross profit margin of approximately 80%, but this can be significantly lower for complex seasonal drinks if the ingredient cost or labor is not managed tightly.[14] Comparing with manually review POS analytic metrics to identify "menu clutter", Unimate Coffee’s AI-robotic ecosystem will automate this process and provide predictive menu suggestion to maximize margin.
The coffee industry of 2026 is one where subtle details dictate the business’s sustainability. By monitoring those operational “leaks” identified in this report, an operator can intervene long before a profit crisis occurs.
[1]: 2024 JUNE CCW MARKET STUDY | CX Trends, Challenges ... - IQPC, accessed April 6, 2026, https://eco-cdn.iqpc.com/eco/files/channel_content/posts/2024-june-market-study-cx-trendsq9DCMFw8Hc1EZibGpA72ikK8gWlyLjhFc1N5Y7Ji.pdf[2]: COGS Analysis for Quick Service Restaurants - Altametrics, accessed April 6, 2026, https://altametrics.com/cogs-formula/cogs-analysis.html[3]: Boosting Your Coffee Shop Profit Margin A Practical Guide - The Restaurant Warehouse, accessed April 6, 2026, https://therestaurantwarehouse.com/blogs/restaurant-equipment/coffee-shop-profit-margin[4]:47 Wait Time Statistics (2026): Customers Leave at 8 Min | ScanQueue Blog, accessed April 6, 2026, https://scanqueue.com/blog/state-of-customer-waiting-2026[5]: Retail Queue Statistics: Wait Times, Queue Abandonment & Customer Behaviour (2026), accessed April 6, 2026, https://www.queueaway.co.uk/blog/retail-queue-statistics[6][: Queue Abandonment Rate: The Metric 87% of Businesses Ignore - Qwaiting Blog, accessed April 6, 2026, https://blog.qwaiting.com/hidden-cost-of-queue-abandonment/[7]: Real-Time Queue Systems - Transforming the Coffee Experience for Cafes and Consumers, accessed April 6, 2026, https://coffeeanalytica.com/blogs/business-chronicles/real-time-queue-systems-transforming-the-coffee-experience-for-cafes-and-consumers[8]: What Café Owners Think Is an Investment but Is Actually Costing ..., accessed April 6, 2026, https://coffeeanalytica.com/blogs/business-chronicles/what-cafe-owners-think-is-an-investment-but-is-actually-costing-them-money